
Crime has increased across much of Cape Town, but several communities historically associated with high levels of violence are moving in the opposite direction, according to the latest South African Police Service statistics.
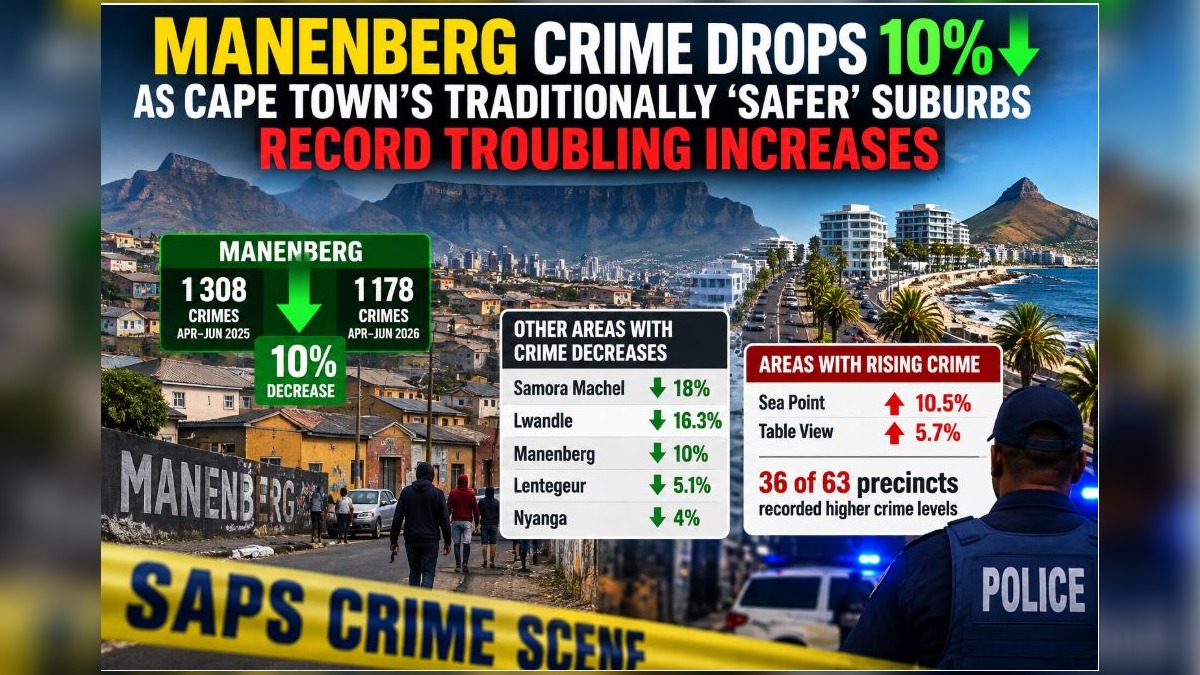
Manenberg is among the most notable examples, recording a 10% year-on-year decline in reported crime during the three months ending June 2026.
The improvement comes despite 36 of Cape Town’s 63 police precincts recording higher crime levels, highlighting a sharply contrasting picture across the city.
Manenberg Records 10% Drop in Crime
Between April and June 2026, Manenberg police recorded 1,178 crimes.
That was down from 1,308 offences during the corresponding three-month period in 2025, representing a decline of approximately 10%.
The figures stand out because Manenberg, situated on the Cape Flats, has historically struggled with serious crime and gang-related violence.
Its latest statistics suggest the precinct has continued a longer-term decline in reported criminal activity.
Drug-Related Offences Remain Manenberg’s Biggest Crime Category
Despite the overall improvement, drug-related offences remain particularly prominent in the area.
SAPS recorded 363 drug-related crimes in Manenberg during the first quarter.
Other frequently recorded offences included theft categories not classified elsewhere, malicious damage to property and common assault.
The figures show that significant crime challenges remain even as the total number of reported offences declines.
Crime Has Fallen Sharply From Levels Recorded a Decade Ago
Manenberg’s latest performance is not simply the result of a single unusually quiet quarter.
The longer-term statistics indicate a substantial reduction in recorded crime over roughly a decade.
During the 2014/15 reporting period, Manenberg recorded 8,681 crimes.
By the year ending March 2026, that figure had fallen to 5,132.
That represents thousands fewer recorded offences compared with the levels reported more than a decade earlier.
Manenberg No Longer Among Cape Town’s 15 Worst Murder Precincts
One of the most significant changes involves murder.
Despite Manenberg’s longstanding reputation for violent and gang-related crime, its police precinct no longer appears among Cape Town’s 15 precincts with the highest murder totals.
By June 2026, Manenberg had recorded 14 murders.
That figure was notably below the 27 murders recorded in Milnerton, an area that may not traditionally carry the same public reputation for extreme violence.
The comparison illustrates how historical perceptions of Cape Town neighbourhoods do not always align with the latest police statistics.
Nyanga and Lentegeur Also Record Crime Reductions
Manenberg is not the only historically high-crime community reporting an improvement.




Crime in Lentegeur declined by 5.1% compared with the corresponding period a year earlier.
Nyanga, another Cape Town community long associated with serious violent crime, recorded a 4% reduction.
The decreases suggest that some precincts facing longstanding crime challenges are recording better results even while Cape Town’s overall picture remains difficult.
Samora Machel Records 18% Decline
Even larger reductions were recorded elsewhere.
Crime in Lwandle declined by 16.3%, according to the figures.
Samora Machel recorded an even greater decrease of 18%.
These reductions place the precincts among the strongest performers in Cape Town during the period under review.
However, improvements across these communities were not enough to reverse the broader increase recorded across much of the metropolitan area.
Crime Worsens Across 36 of Cape Town’s 63 Precincts
While several historically dangerous areas recorded declines, the majority of Cape Town police precincts did not share that improvement.
Crime increased in 36 of the city’s 63 precincts.
The latest data puts Cape Town’s crime rate at 5.16%, demonstrating that the city continues to face substantial public-safety challenges despite improvements in selected communities.
The geographical distribution of those increases also complicates assumptions about where residents are most likely to encounter crime.
Cape Town Central Records City’s Highest Crime Total
Cape Town Central remains particularly prominent in the statistics.
The precinct recorded more crime than any other police precinct in the city.
As a busy commercial, tourism and entertainment district, Cape Town Central experiences circumstances considerably different from predominantly residential precincts, meaning raw crime totals do not necessarily provide a direct measure of an individual resident’s risk.
Nevertheless, its position at the top of the city’s recorded crime figures demonstrates the scale of policing demands in the central business district.
Sea Point Crime Climbs 10.5%
Some of Cape Town’s better-known coastal and suburban areas also experienced increases.
Sea Point recorded a 10.5% rise in crime.
Table View experienced an increase of 5.7%.
Those results contrast sharply with the reductions reported in Manenberg, Lwandle, Lentegeur, Nyanga and Samora Machel.
Sea Point Matches Three High-Crime Areas for Residential Burglaries
The statistics become particularly striking when individual offences are compared.
Between April and June 2026, Sea Point recorded the same number of residential burglaries as Lentegeur, Lwandle and Manenberg.
That does not mean the four precincts have identical overall crime conditions, as their populations, geographic characteristics and other categories of crime differ.
However, it highlights how specific offences can be significant even in communities generally perceived as safer.
Table View Records More Aggravated Robberies Than Several Cape Flats Areas
A similar pattern emerges in Table View.
During the same reporting period, Table View recorded more aggravated robberies than Lwandle, Lentegeur and Manenberg.
Again, the comparison challenges simplistic divisions between supposedly safe and dangerous parts of Cape Town.
Crime patterns vary substantially depending on the offence being examined, and neighbourhood reputations developed over many years may not reflect current statistics.
Cape Town’s Crime Map Is Changing
The latest figures ultimately present two different stories about crime in Cape Town.
Across most police precincts, the situation deteriorated, with 36 of 63 stations reporting increases compared with the same period in 2025.
But several communities historically associated with some of the city’s most serious crime problems experienced meaningful declines.
Manenberg’s 10% reduction is particularly significant when viewed alongside its longer-term improvement from 8,681 recorded crimes in 2014/15 to 5,132 in the year ending March 2026.
With crime also declining in Nyanga, Lentegeur, Lwandle and Samora Machel while increasing in areas including Sea Point and Table View, Cape Town’s latest police statistics show that the city’s crime landscape is becoming more complicated than traditional neighbourhood reputations might suggest.
