Ethereum (ETH) is showing a macroeconomic pattern that recalls the conditions leading up to its explosive 2021 rally.
Analysts are pointing to a sequence linking global liquidity, U.S. small-cap stocks, and ETH price action, suggesting a potential repeat could be on the horizon for the altcoin.
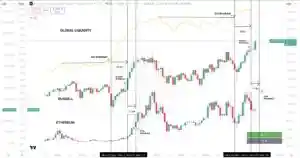
Global Liquidity and the Russell 2000 Signal a Possible Breakout
Crypto strategist Sykodelic highlighted a recurring three-step pattern: first, a breakout in global liquidity; second, a surge in the Russell 2000 index; and finally, a delayed breakout in Ethereum.
On the current monthly charts, this sequence appears to be unfolding once more.
Historically, Ether tends to lag these signals.
In 2021, ETH began its major rally roughly 119 days after the Russell 2000 confirmed its breakout.
If history repeats, some analysts are eyeing March 2026 as a potential breakout window for Ethereum.
The monthly candle on the Russell 2000 mirrors the previous cycle, hinting at a similar risk-on market regime. Back then, ETH surged 226% between March and November 2021.


ETH Accumulation Signals Solid Support
Onchain data reinforces the bullish setup. CryptoQuant shows that ETH accumulation addresses are steadily increasing, with the realized price hovering near $2,720.
This realized price has historically acted as a strong support zone for long-term holders and has rarely been broken during past drawdowns.
The proximity of this accumulation zone to the current market price suggests investors are actively building positions.
Analysts estimate that if ETH revisits this level, downside could be limited to roughly 7%, establishing a potential local bottom near $2,720.
Coupled with external liquidity zones, this strengthens the likelihood of a trend response if tested.
Russell 2000 Leadership Could Favor ETH Upside
Max, CEO of BecauseBitcoin, noted that the Russell 2000 has historically led Ethereum during price discovery phases.
With the index recently hitting a new all-time high at 2,738, this leadership could again favor an upside expansion for ETH in the coming weeks if the correlation holds.
The combination of strong accumulation, realized price support, and macro indicators from global liquidity and U.S. small-cap equities creates a setup reminiscent of the conditions before the 2021 ETH rally.
While short-term technicals matter, analysts argue that liquidity conditions may have the greater influence on long-term trends for high-beta assets like Ethereum.
Takeaways and Caution
While the charts and macro setups suggest a potentially bullish path, this is not financial advice.
Every trading and investment decision carries risk, and readers should conduct their own research.
Past performance is not a guarantee of future results, and forward-looking statements are inherently uncertain.
Ethereum’s macro setup, however, remains one to watch closely in the months ahead as liquidity trends and accumulation patterns continue to unfold.
Share on Facebook «||» Share on Twitter «||» Share on Reddit «||» Share on LinkedIn